

Since the dawn of the information age, organizations have sought to achieve a competitive advantage by turning their data into actionable insights and Business Intelligence (BI). Environment, Health, and Safety (EHS) leaders, who are responsible for both mitigating operational risk AND driving improvements to the organization’s bottom line, understand the value of data better than most. Unfortunately, this critical business function often struggles to get support for their analytics needs. In a recent report by industry analyst Verdantix, nearly 70% of EHS leaders said they lack quality data and analytical tools and an astounding 60% said that the cost of analytics projects outweighed the benefits.
Why the pessimism? Much of it likely has to do with the outdated impression of EHS as a “cost center” responsible for keeping agency inspectors at bay. While forward-thinking organizations recognize EHS as strategic leaders of operational efficiency and risk management, the residual effect of decades of viewing EHS as the ‘compliance department’ has resulted in a lack of resources and investment in EHS systems. Couple that with a lack of data literacy and inexperience presenting business cases, and it’s no wonder that EHS leaders lag behind on the journey to data-driven decision making.
Why EHS Needs to be Data-driven
While analytical tools and quality of data may be lacking for some, the quantity of data captured by EHS departments is only increasing. Aided by mobile-equipped frontline workers and automated data collection via sensors and beacons, EHS is collecting more data than ever before. While the Fourth Industrial Revolution, or Industry 4.0, has created an abundance of raw data, it can be overwhelming and difficult to get a true picture of performance.
When leveraged correctly, EHS data can help identify hidden safety trends, justify capital projects to management, and, thanks to the government’s open data policies, identify frequent or costly compliance violations for a given industry. EHS tracks a variety of leading and lagging indicators that can be used to get this picture. Leading indicators are tracked in an attempt to predict future issues and lagging indicators measure past performance.
While they vary from industry to industry, there are some common Key Performance Indicators (KPIs) that are utilized across EHS disciplines:
- Health & Safety – On the leading edge, safety managers tend to focus on near misses and observations related to hazardous conditions and behaviors as well as completion rates for employee safety training. On the lagging side, OSHA injury and illness reports, such as Total Recordable Injury Rate (TRIR), and worker compensation costs are standards for measuring the results of safety programs.
- Environmental – Audits, while only a snapshot of current environmental performance status, can provide leading indicators when conducted strategically or proactively as self-assessments. The volume of toxic chemicals released to air, water, and land, usually related to regulatory requirements and local permits, are popular lagging indicators of environmental programs.
- EHS Compliance – Review of the number, type, and/or level of various regulatory certifications and/or EHS management systems are good leading indicators of compliance. Compliance audits can provide both leading and lagging indicators, as can on-time completion percentage of tasks and corrective actions. Notices of violations (NOV) from regulatory agencies and the associated costs of fines and penalties are typical lagging indicators of EHS compliance programs.
- ESG – The drive by the investment community to unify Environmental, Social, and Governance (ESG) disclosures has driven the need for accurate reporting tools and “investment-grade” data management. While there is significant overlap with EHS-related metrics, such as those related to carbon emissions and worker safety performance, ESG also looks at economic, geopolitical, societal, and other risk factors that can inform organizational strategy. Each organization’s KPIs will vary based on a materiality assessment which outlines what data is most important to stakeholders and has the greatest impact on the organization.
Talking the Talk: Key Terms
It’s important to understand the relationship of leading and lagging indicators to outputs, things we do, and outcomes, the results we hope to achieve by doing the things we do. These terms have become prevalent in boardrooms and point to the importance of meaningful goal setting and the need to be fluent in the language of data and analytics.
Organizational functions that drive and support revenue, such as Sales, Marketing, IT, HR, and Customer Support, have traditionally been early adopters of technology and, therefore, learned the language of data and analytics early. Operations and EHS, traditionally in the later majority of the technology adoption lifecycle, must improve their data literacy so they can engage in conversations and steer data and analytics discussions.
Data literacy is the ability to read, understand, create, and communicate data as information. Let’s look at some of the common terms, starting with goal setting and work down to types of data:
SMART Goals – In use since the early 1980’s SMART is a mnemonic acronym intended to guide in the setting of goals and objectives for better results. In Using Leading Indicators to Improve Safety and Health Outcomes, OSHA outlines how good leading indicators are based on SMART principles. The SMART goal terminology should be part of the vocabulary of all EHS managers and safety leaders.
- Specific: Does your leading indicator provide specifics for the action that you will take to minimize risk from a hazard or improve a program area?
- Measurable: Is your leading indicator presented as a number, rate, or percentage that allows you to track and evaluate clear trends over time?
- Accountable: Does your leading indicator track an item that is relevant to your goal?
- Reasonable: Can you reasonably achieve the goal that you set for your leading indicator?
- Timely: Are you tracking your leading indicator regularly enough to spot meaningful trends from your data within your desired timeframe?
Business Intelligence – Goal setting and measurement should be informed by Business Intelligence (BI). According to Forrester Research, BI is “a set of methodologies, processes, architectures, and technologies that transform raw data into meaningful and useful information used to enable more effective strategic, tactical, and operational insights and decision-making.” For established industries, BI indicators are usually well-defined, though disruptive technologies, societal trends, and globalization are driving the need for analytical tools that provide flexible BI.
Data Analytics – Data analytics is the process of transforming data into insights to improve decision making. It focuses on what happened (descriptive analytics), why something happened (diagnostic analytics), what is going to happen (predictive analytics), and what should be done next (prescriptive analytics). Individuals who work with data analytics, rely on a variety of software tools ranging from spreadsheets, visualization and reporting tools, data mining programs, and open-source languages to manage and manipulate data.
Data Normalization – Data normalization means you are enabling “Apples to Apples” comparisons that set the stage for analytical and BI success. The technical definition from Wikipedia: “Database normalization is the process of structuring a relational database in accordance with a series of so-called normal forms in order to reduce data redundancy and improve data integrity.”
Centralized Data – EHS Leaders need a “Single Source of Truth” for data that eliminates silos, ensures integrity, improves governance, and optimizes analytics. Wikipedia says: “A centralized database is located, stored, and maintained in a single location… most often a central computer or database system. Users access a centralized database through a computer network which is able to give them access to the central CPU.”
- Operational Data – It’s also important to distinguish between different data types as they provide different types of insights. For EHS managers, Operational Data is the transactional data that is accessed as part of day-to-day workflows (ex: conducting an inspection or reporting an incident). With the right software tools, operational data can empower EHS leaders to leverage their knowledge of the site, personnel, and processes to gain “on the fly” insights.
- Analytical Data – Analytical Data is essentially Operational Data but stored and utilized specifically to provide insights for business decisions. While the questions this data answers can vary greatly, for EHS departments it typically includes data related to incidents, inspections, audits, tasks and corrective actions, and can be used to present trends and comparisons. Analytical Data is best stored in a Data Warehouse which is designed for heavy aggregation, data mining, and ad hoc queries.
Data Journey – There are many definitions of data journey but we like Statistics Canada’s best: “The data journey represents the key stages of the data process. The journey is not necessarily linear; it is intended to represent the different steps and activities that could be undertaken to produce meaningful information from data.”
Data-driven – The adjective data-driven means that activities are driven by data, rather than by intuition or by personal experience. Simply put, it means that the organization is using data, analytics, and business intelligence to set strategic goals and measure performance.

“If we have data, let’s look at data. If all we have are opinions, let’s go with mine.”
– James Love Barksdale, former president and CEO of Netscape Communications
Most organizations realized long ago that they can’t rely on opinions when it comes to EHS performance. They know they need structured data that informs decision making, but they don’t always know how to get it. Since you’re reading this, you’ve already taken an important first step toward becoming data-driven. The next step is an honest assessment of your organization’s data maturity and where your EHS department is on the data journey.
The Stages of Data-driven EHS Management
Stage 1 – Data Denial
In this stage, chaos rules. Here you will find paper-based processes and disparate spreadsheets scattered across network drives. With information and data locked away on desktops and forgotten folders, it’s nearly impossible for EHS leaders to identify or resolve issues. Fortunately, most organizations realize that EHS impacts are far too important and have moved beyond this stage.
Stage 2 – Data Indifference
In this stage, data is acknowledged but still unstructured. Here the dreaded “data silos” lead to limited visibility and accountability. With no centralized data repository, collbusiness units are left to make their own independent decisions. Stage 2 is dominated by ‘gut feelings’ and ‘hunches’. “I think that…” or “I feel that…” are common drivers of decisions. Organizations with significant EHS risks dare not linger in this stage for long.
Stage 3 – Data Aware
In this stage, data may or may not be centralized, but it is still unstructured or only semi-structured. Some locations and business units may be working together, but data curation is still manual and time consuming. Combining data of multiple sources requires specialized roles or reports and is performed manually. “I think that…” or “I feel that…” are STILL common drivers of decisions but, like the quote above from Netscape’s former CEO, are now HIPPOs (the Highest Paid Person’s Opinion). EHS departments in the mid range of data maturity may still reside here.
Stage 4 – Data Informed
In this stage, data has been combined into a central repository, but may still take substantial effort to maintain or add new data sets to. Data curation is mostly automated and centralized dashboards have become popular with EHS and site leaders. Business decisions can now be made based on data analysis, but significant effort is required to get the data correlated. Most mature EHS departments have made it to, or are close to reaching, this stage.
Stage 5 – Data Driven
In this stage, data is king. The ability to add new data sets to a centralized repository has been streamlined, data curation is automated and are normalized at data entry. Less specialized roles are required to generate reports and analysis (generally an analytics platform is in place and has been optimized for use by non-developers). Business questions can be answered immediately, or in a short time-frame, and corporate EHS has full visibility across the enterprise. In a data-driven environment, “Trends indicate that…” and “What if we looked at…” become common phrases for business decisions.
Pitfalls in Becoming Data-driven
Changing processes, creating new technical avenues, and adapting your culture to base decisions on data instead of feelings happens at multiple levels and doesn’t occur overnight. Even when you speak the “language of data” fluently, technical, cultural, and procedural pitfalls can trip you up if you’re not prepared. Here are some of the obstacles to watch for on the path to become data driven.
Avoid preconceived notions and sweeping changes
Even when you have become efficiently data driven, you will need to continually ask questions and look at your performance from different angles to evolve. Plan for this being a continuous improvement cycle and remember that small changes may be a better approach to get acceptance than sweeping alterations. In the world of software development, we talk about ‘iterations.’ Frequent cycles where theories are tested and small improvements, building upon each other, are continuously made. This same ‘continuous improvement’ cycle should be familiar to EHS and part of your data analytics approach.
Don’t limit future analysis opportunities
You may be focused on just getting off the ground today, but tomorrow you’ll want more data and more analysis. Consider your upfront investment of time vs. the cost to change later. Do the extra work up front to enable the “ideal future state” for your EHS analytics needs. How likely is missing data? Is your data set looking at information that’s often skewed, like on-time completion percentage of tasks? Consider these scenarios early in the process. Avoiding problems is much easier than fixing them later on.
Don’t get lost in the weeds
While you want to avoid future problems, remember to focus on your outcomes and don’t let yourself get caught up in the details. It’s exciting to see all of your EHS variables in one place. It’s tempting to start building endless graphs and charts but, if it’s not getting you any closer to the answers you need, you’re probably in the weeds. Keep asking the question: “Does this really help us achieve our stated EHS goals?”.
Avoid “analysis paralysis”
Having more data available can sometimes be scary and it can cause you to overthink a problem to the point that you can’t make a decision. Setting due dates and prioritizing decision making criteria can help you know how much is too much when it comes to analyzing EHS data. In the end, data-driven processes will mitigate risk, not eliminate it. Data analytics and business intelligence can inform decision making, not replace it.
Getting Started on Your Data-driven Journey
It’s clear that actionable business intelligence is essential to EHS management, where strong performance can reduce costly incidents and the likelihood of fines and penalties, improve moral and brand perception, and increase confidence with investors. While these benefits are well known, and the direct and indirect costs are well understood, effective data analytics capabilities have remained elusive for many EHS leaders. Why?
Decisions to make IT investments are usually made on the basis of a Business Case. How will costs be reduced? Risks mitigated? Efficiencies gained? By how much? How quickly? Answering these questions is essential to a successful pitch to senior management. Unfortunately, EHS leaders don’t always speak the same language as business leaders do and they often lack the experience to make the business case. These tips can get you started in the right direction.
Choosing the Right BI Platform
Selecting an EHS analytics platform that meets your needs must also be part of your ROI discussion. Platforms like Power BI and Tableau have become popular and can handle the collection, integration, analysis, and presentation of all types of data, but they come with a steep learning curve, especially for those who aren’t already fluent in the language of data. These type of systems must also be integrated with your EHS systems, something that may require the support of your inhouse IT resources.
Platforms that integrate with your operational data “out-of-the-box” are beneficial as they negate the need to curate EHS data manually and can provide more consistent and accurate data for analysis. Systems should include out-of-the-box indicators of EHS performance, but also be flexible enough to accommodate your unique analytics needs.
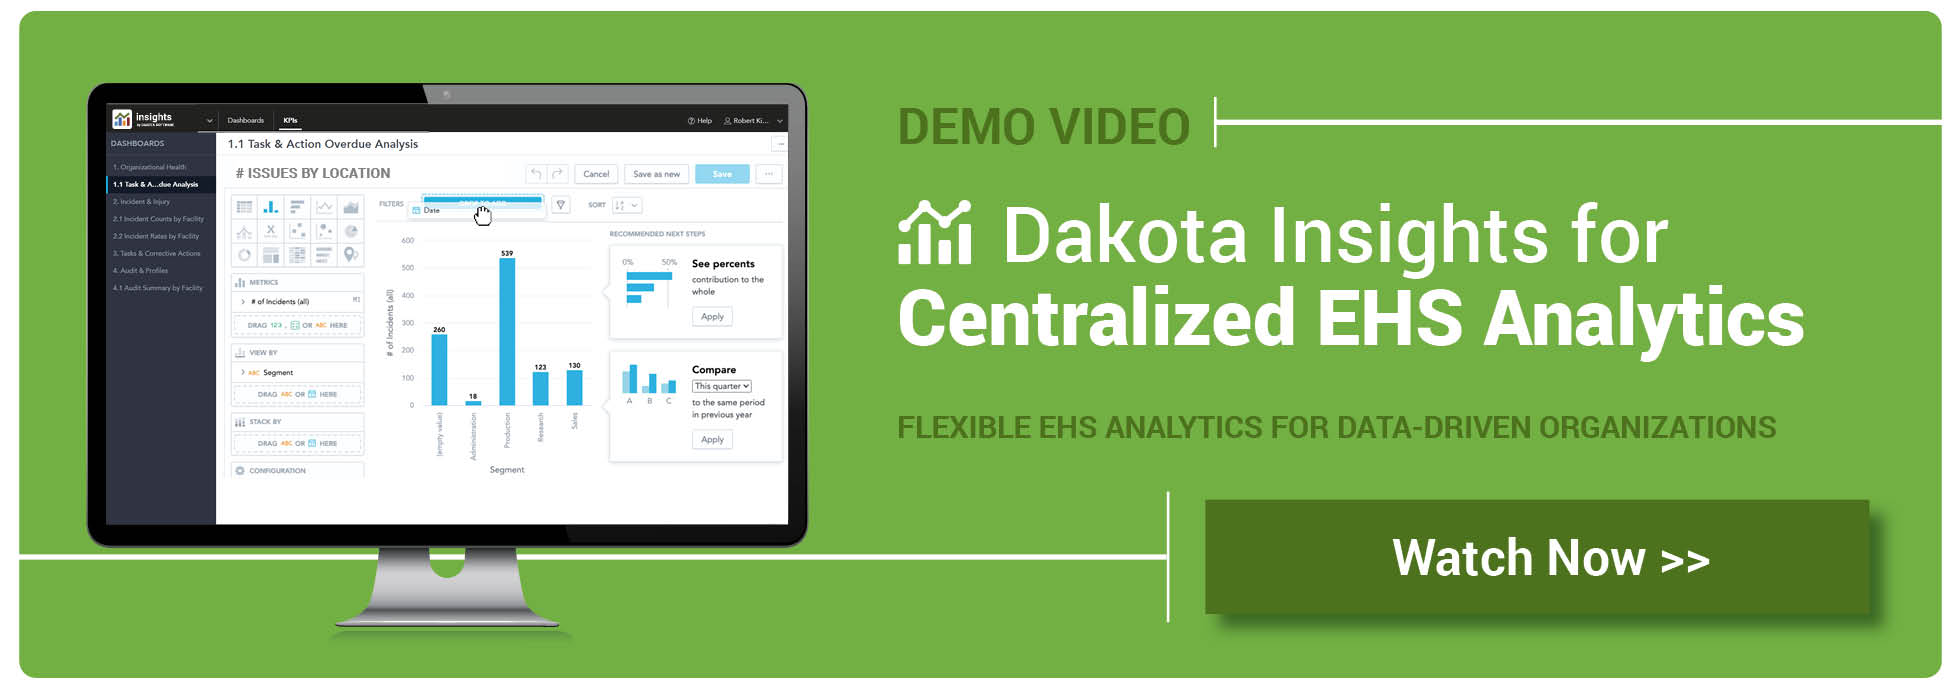
For Dakota Software clients, Dakota Insights allows users to easily build and share customized dashboards that draw from the day-to-day operational data already managed in the ProActivity Suite. For those starting from scratch, or dissatisfied with their current EHS analytics capabilities, Dakota Insights provides a holistic view of EHS performance and, coupled with our regulatory content-driven ProActivity Suite, enables true end-to-end EHS management.
Contact us today to get started, or to take the important next step, on your data-driven journey.